
الشموع اليابانية وقراءة الشارت | Candlestick Charts
تعلّم ببساطة، خطوة بخطوة
Learn simply, step by step
معلومة واضحة، ثم خطوة جديدة.
Clear knowledge, one step at a time.
الشموع اليابانية وقراءة الشارت Candlestick Charts
🎯 ماذا ستتعلم؟
في هذا الدرس ستتعرف على الشموع اليابانية وكيف تساعدك على قراءة حركة السعر على الشارت، وفهم المعلومات الأساسية التي تعرضها كل شمعة.
🕯️ ما هي الشموع اليابانية؟
هي طريقة شائعة لعرض حركة سعر الأصل خلال فترة زمنية محددة. ويمكن أن تمثل الشمعة دقيقة أو ساعة أو يومًا أو أي إطار زمني آخر تختاره على الشارت.
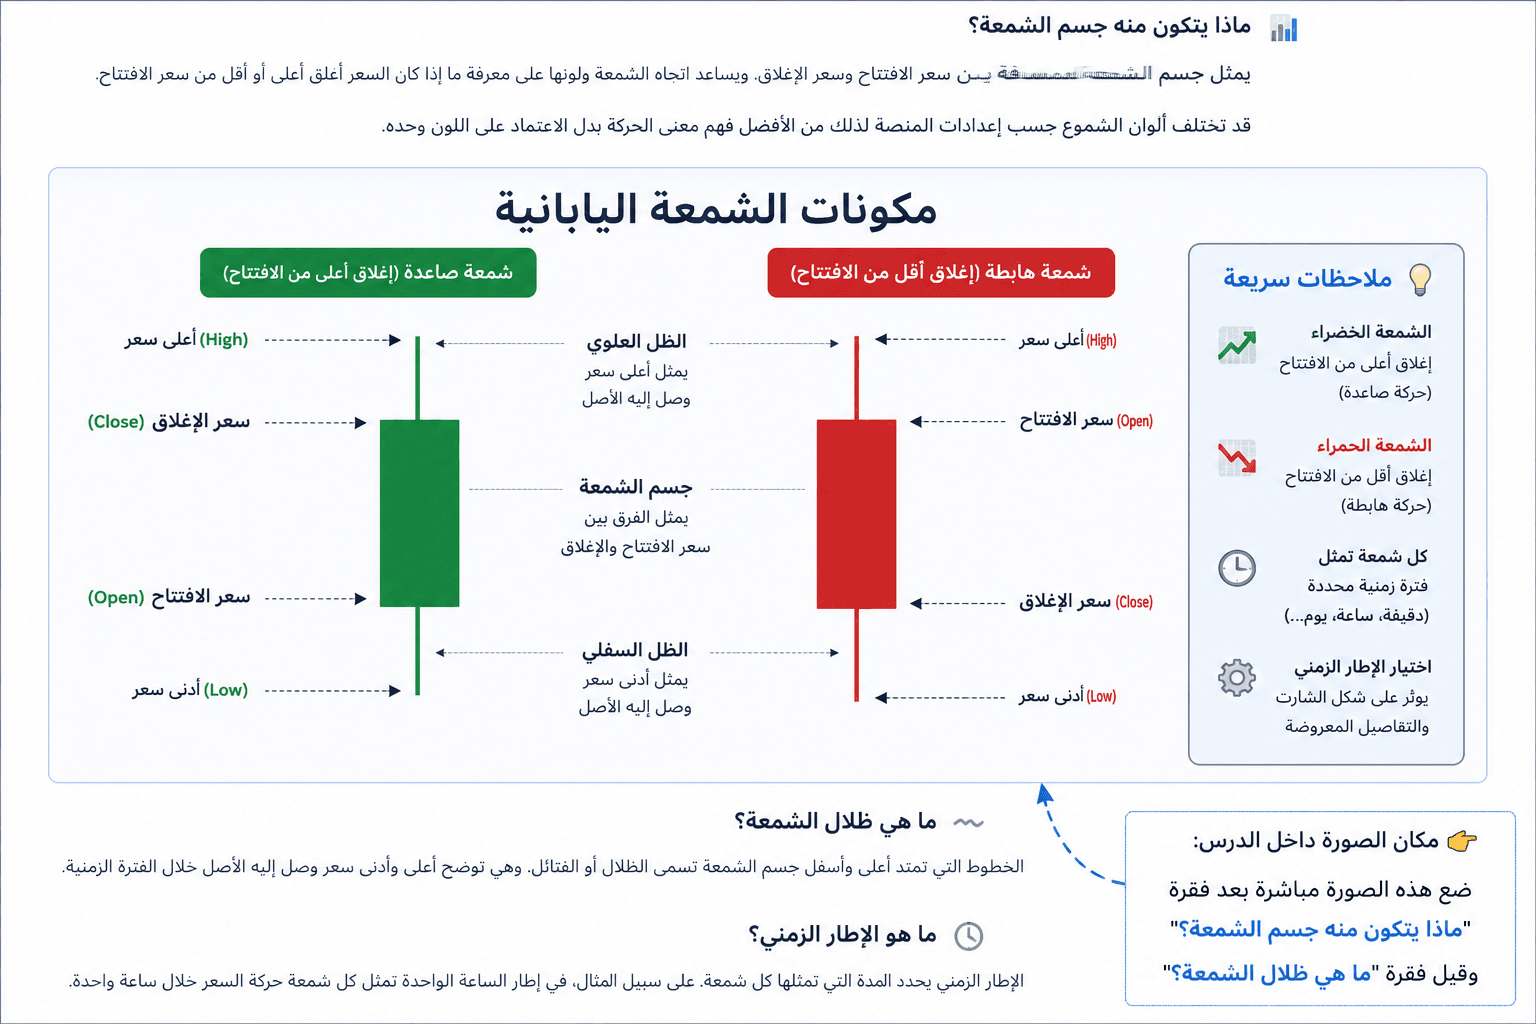
تعرض كل شمعة أربعة أسعار أساسية: سعر الافتتاح، وأعلى سعر، وأدنى سعر، وسعر الإغلاق خلال الفترة المحددة.
📊 ماذا يتكون منه جسم الشمعة؟
يمثل جسم الشمعة المسافة بين سعر الافتتاح وسعر الإغلاق. ويساعد اتجاه الشمعة ولونها على معرفة ما إذا كان السعر أغلق أعلى أو أقل من سعر الافتتاح.
قد تختلف ألوان الشموع حسب إعدادات المنصة، لذلك من الأفضل فهم معنى الحركة بدل الاعتماد على اللون وحده.
〰️ ما هي ظلال الشمعة؟
الخطوط التي تمتد أعلى وأسفل جسم الشمعة تسمى الظلال أو الفتائل. وهي توضح أعلى وأدنى سعر وصل إليه الأصل خلال الفترة الزمنية.
⏱️ ما هو الإطار الزمني؟
الإطار الزمني يحدد المدة التي تمثلها كل شمعة. على سبيل المثال، في إطار الساعة الواحدة تمثل كل شمعة حركة السعر خلال ساعة واحدة.
لذلك قد يبدو نفس السوق مختلفًا عند الانتقال بين إطار زمني قصير وإطار زمني أطول.
🔍 هل تكفي شمعة واحدة لاتخاذ قرار؟
لا. تساعد الشموع اليابانية على فهم حركة السعر، لكن الاعتماد على شمعة واحدة فقط لا يكفي عادةً لتقييم السوق أو توقع الحركة التالية.
🧠 تذكّر
- كل شمعة تمثل فترة زمنية محددة.
- الشمعة تعرض الافتتاح والأعلى والأدنى والإغلاق.
- جسم الشمعة يوضح العلاقة بين الافتتاح والإغلاق.
- الظلال توضح أعلى وأدنى سعر خلال الفترة.
- لا تعتمد على شمعة واحدة لاتخاذ قرار تداول.
📚 للمزيد، يمكنك قراءة
شرح Investopedia لمخططات الشموع
.
📘 راجع الدرس السابق:
أنواع أوامر تداول العملات الرقمية
🎯 What Will You Learn?
In this lesson, you will learn the basics of Candlestick Charts, how they help you read price movements, and what information each candle displays.
🕯️ What Are Candlestick Charts?
They are a popular way to display the price movement of an asset over a specific period. A candle can represent one minute, one hour, one day, or another timeframe selected on the chart.
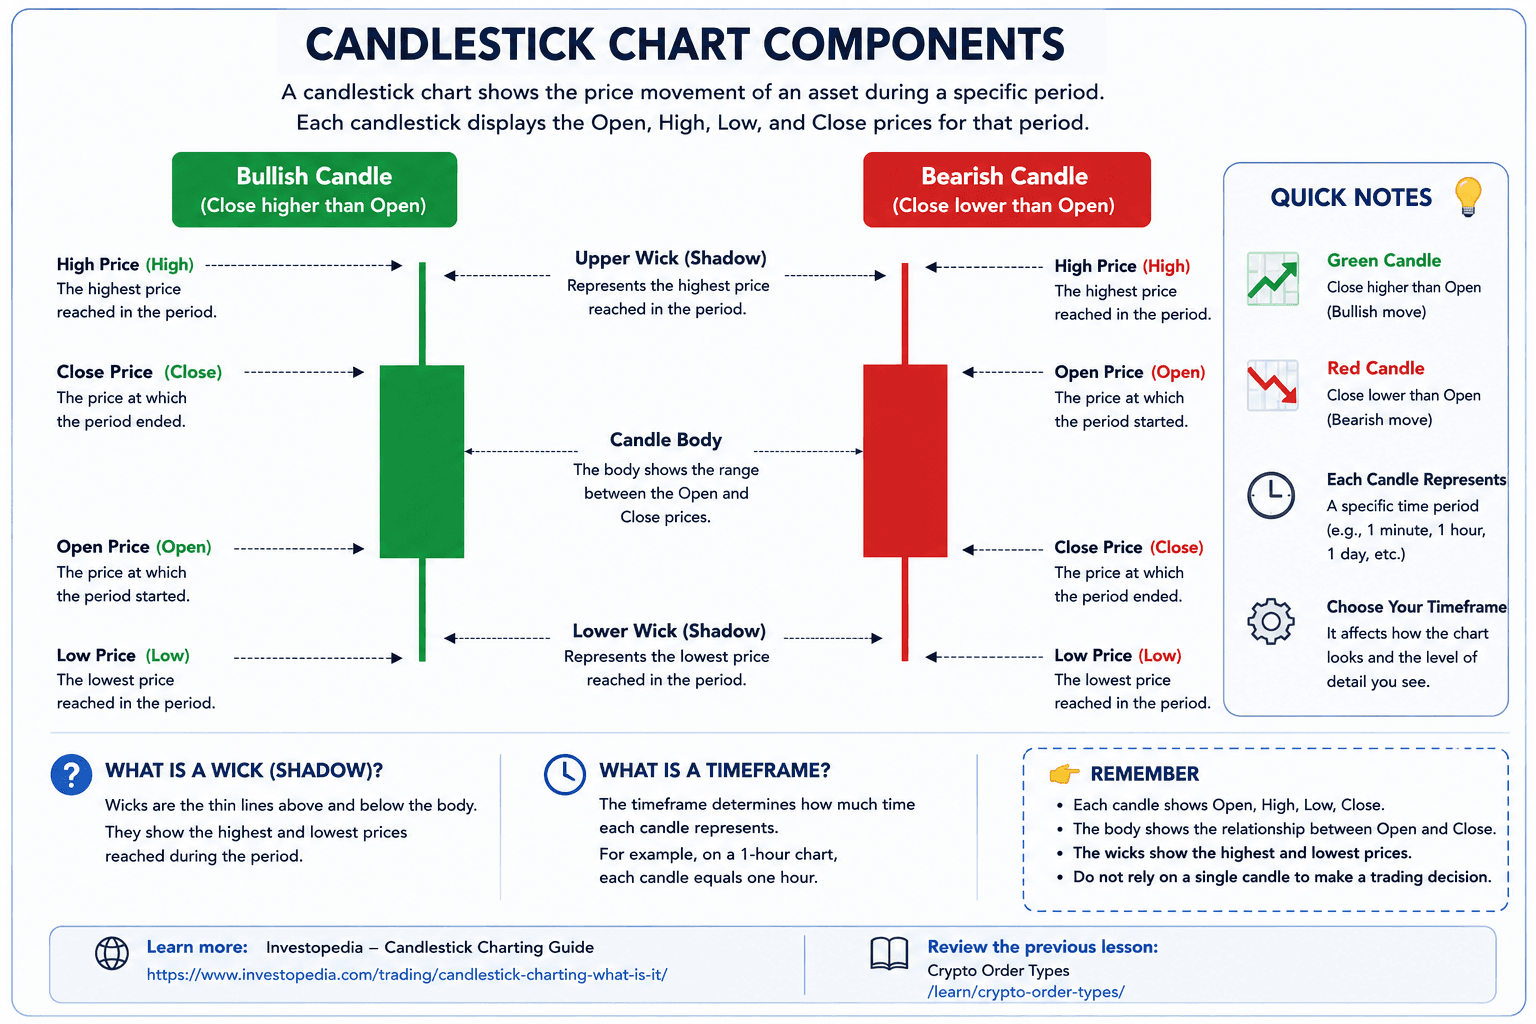
Each candle displays four main prices: the opening price, highest price, lowest price, and closing price during that period.
📊 What Is the Candle Body?
The candle body represents the distance between the opening and closing prices. Its direction and color can help show whether the price closed above or below its opening price.
Candle colors may vary depending on the platform or chart settings, so it is better to understand the price movement rather than rely only on color.
〰️ What Are Candle Wicks?
The lines extending above and below the candle body are called wicks or shadows. They show the highest and lowest prices reached during the selected period.
⏱️ What Is a Timeframe?
The timeframe determines how much time each candle represents. For example, on a one-hour timeframe, each candle represents one hour of price movement.
The same market can therefore look different when switching between shorter and longer timeframes.
🔍 Is One Candle Enough to Make a Decision?
No. Candlestick Charts can help you understand price movements, but relying on a single candle is usually not enough to evaluate the market or predict the next move.
🧠 Remember
- Each candle represents a specific period of time.
- A candle shows the open, high, low, and close prices.
- The body shows the relationship between the open and close.
- The wicks show the highest and lowest prices during the period.
- Do not rely on a single candle to make a trading decision.
📚 For more information, see
Investopedia's guide to candlestick charts
.
📘 Review the previous lesson:
Crypto Order Types
اختبر فهمك
Check Your Understanding
سؤالان سريعان لتثبيت أهم ما تعلمته.
Two quick questions to reinforce the key ideas.