
حجم التداول والمؤشرات الفنية | Volume & Technical Indicators
تعلّم ببساطة، خطوة بخطوة
Learn simply, step by step
معلومة واضحة، ثم خطوة جديدة.
Clear knowledge, one step at a time.
حجم التداول والمؤشرات الفنية Volume & Technical Indicators
🎯 ماذا ستتعلم؟
في هذا الدرس ستتعرف على حجم التداول، وما الذي يمكن أن يخبرك به عن نشاط السوق، بالإضافة إلى فكرة مبسطة عن المؤشرات الفنية المستخدمة في قراءة الشارت.
📊 ما هو حجم التداول؟
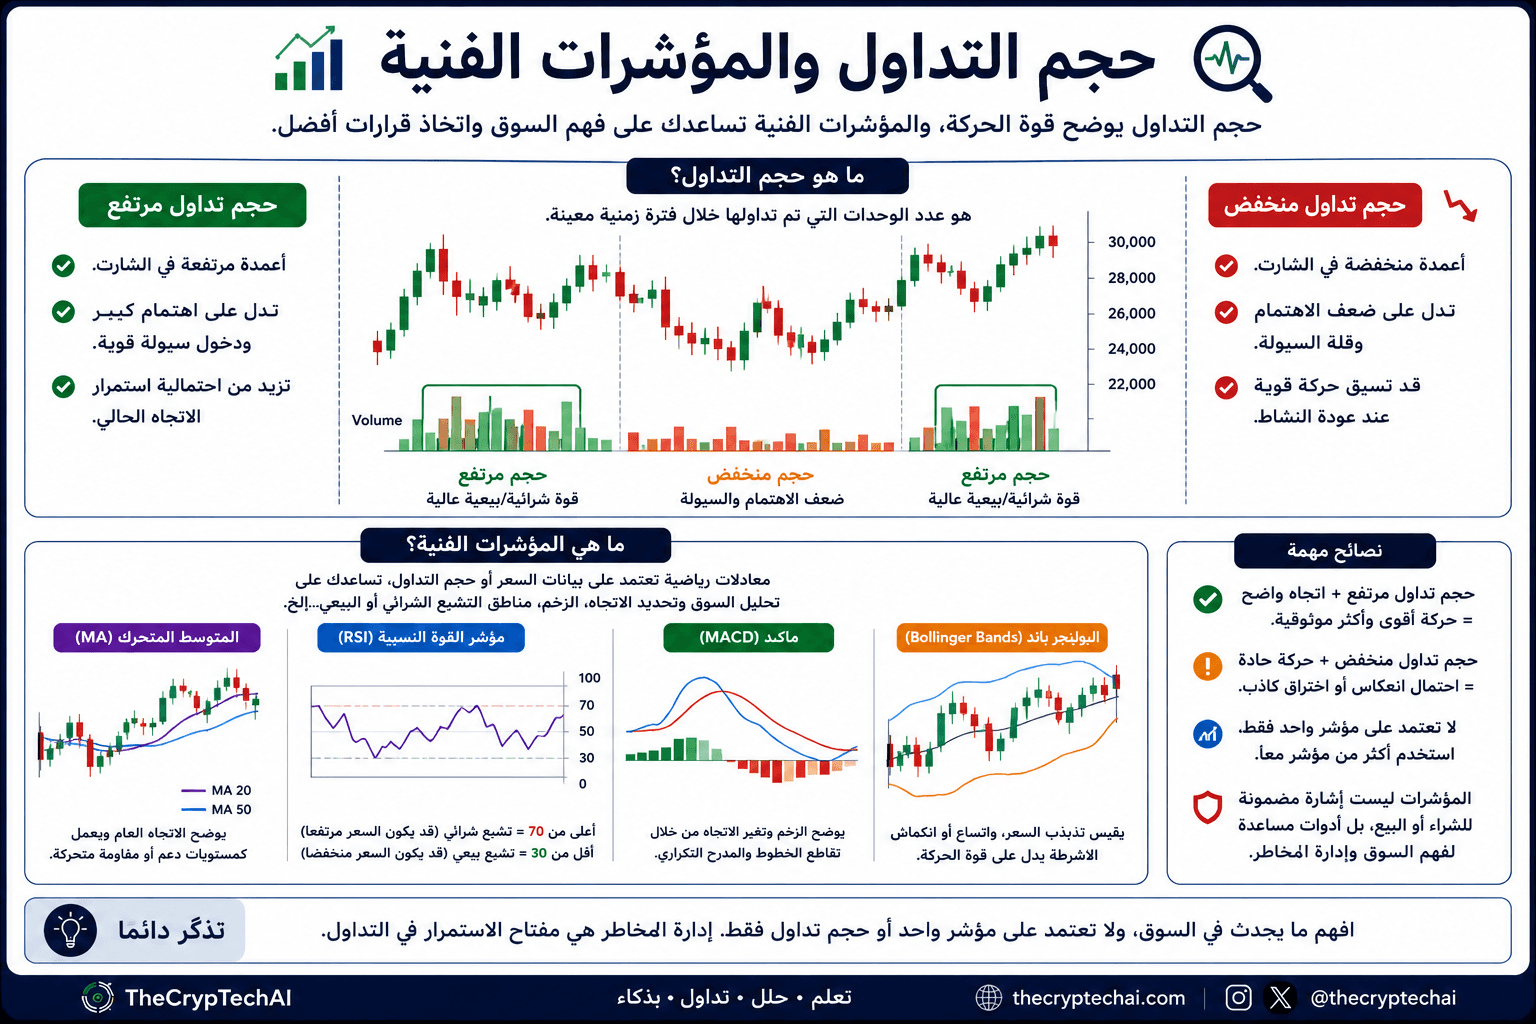
هو مقدار الأصل الذي تم تداوله خلال فترة زمنية محددة. ويظهر عادةً على الشارت في صورة أعمدة أسفل حركة السعر.
كلما زاد النشاط في السوق ارتفعت كمية التداول، بينما يشير انخفاضها إلى وجود نشاط أقل خلال تلك الفترة.
📈 ماذا يعني الحجم المرتفع؟
ارتفاع الحجم يعني وجود نشاط أكبر من المشترين والبائعين. وعندما تحدث حركة سعرية واضحة مع نشاط مرتفع، فقد يعطي ذلك معلومات إضافية عن قوة الحركة.
لكن ارتفاع الحجم وحده لا يعني أن السعر سيرتفع، لأنه يشمل عمليات الشراء والبيع معًا.
📉 ماذا يعني الحجم المنخفض؟
الحجم المنخفض يعني أن كمية التداول خلال الفترة أقل. وقد تكون حركة السعر في هذه الحالة مصحوبة بمشاركة أقل من المتداولين.
🧮 ما هي المؤشرات الفنية؟
المؤشرات الفنية هي أدوات تعتمد على حسابات تستخدم بيانات مثل السعر أو كمية التداول لمساعدة المتداول على قراءة حركة السوق.
ومن أمثلتها المتوسطات المتحركة MA ومؤشر القوة النسبية RSI وMACD وBollinger Bands.
🔍 هل يجب الاعتماد على مؤشر واحد؟
لا. يمكن استخدام حجم التداول والمؤشرات الفنية لفهم السوق بصورة أفضل، لكنها لا تضمن اتجاه السعر ولا يجب الاعتماد على إشارة واحدة فقط لاتخاذ قرار تداول.
في الدرس التالي سنتعرف بصورة أبسط على ثلاثة مؤشرات شائعة: RSI وMACD والمتوسطات المتحركة.
🧠 تذكّر
- الحجم يقيس مقدار الأصل المتداول خلال فترة محددة.
- ارتفاعه يعني وجود نشاط أكبر في السوق.
- انخفاضه يعني وجود نشاط أقل خلال الفترة.
- المؤشرات الفنية تعتمد على بيانات السوق لإجراء حسابات مختلفة.
- لا يوجد مؤشر يضمن اتجاه السعر أو نتيجة الصفقة.
📚 للمزيد، يمكنك قراءة
شرح Investopedia لحجم التداول
.
📘 راجع الدرس السابق:
الدعم والمقاومة
🎯 What Will You Learn?
In this lesson, you will learn about Trading Volume, what it can tell you about market activity, and the basic idea behind technical indicators used to read charts.
📊 What Is Trading Volume?
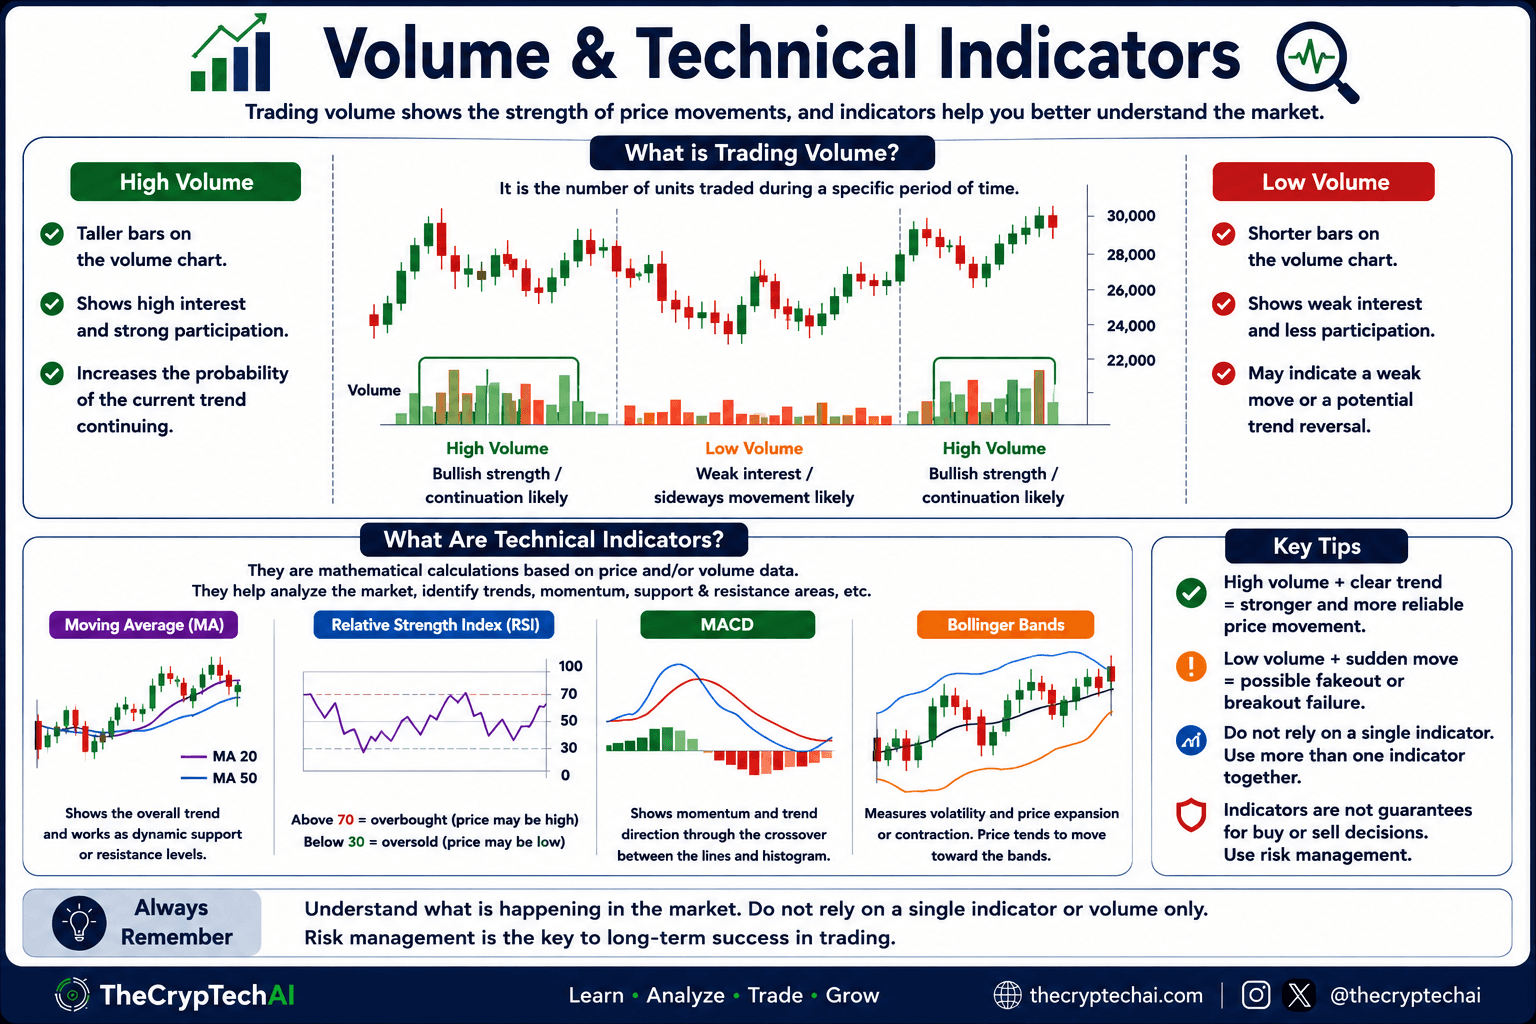
It is the amount of an asset traded during a specific period of time. It is usually displayed as bars below the price chart.
When market activity increases, the amount traded may rise. Lower volume generally indicates less trading activity during that period.
📈 What Does High Volume Mean?
High volume means there is greater activity from buyers and sellers. When a clear price movement occurs with high activity, it may provide additional information about the strength of that move.
However, high volume alone does not mean that the price will rise because trading activity includes both buying and selling.
📉 What Does Low Volume Mean?
Low volume means that less of the asset is being traded during the selected period. Price movements during low-volume periods may involve fewer market participants.
🧮 What Are Technical Indicators?
Technical indicators are tools based on calculations that use market data such as price or volume to help traders understand market movements.
Common examples include Moving Averages (MA), the Relative Strength Index (RSI), MACD, and Bollinger Bands.
🔍 Should You Rely on One Indicator?
No. Trading Volume and technical indicators can help you understand the market, but they cannot guarantee future price direction and should not be used as a single signal for a trading decision.
In the next lesson, we will take a closer look at three common indicators: RSI, MACD, and Moving Averages.
🧠 Remember
- Volume measures how much of an asset is traded during a specific period.
- Higher volume means greater market activity.
- Lower volume means less activity during that period.
- Technical indicators use market data to perform different calculations.
- No indicator can guarantee price direction or the result of a trade.
📚 For more information, see
Investopedia's guide to trading volume
.
📘 Review the previous lesson:
Support and Resistance
اختبر فهمك
Check Your Understanding
سؤالان سريعان لتثبيت أهم ما تعلمته.
Two quick questions to reinforce the key ideas.